No items found.
Analytics

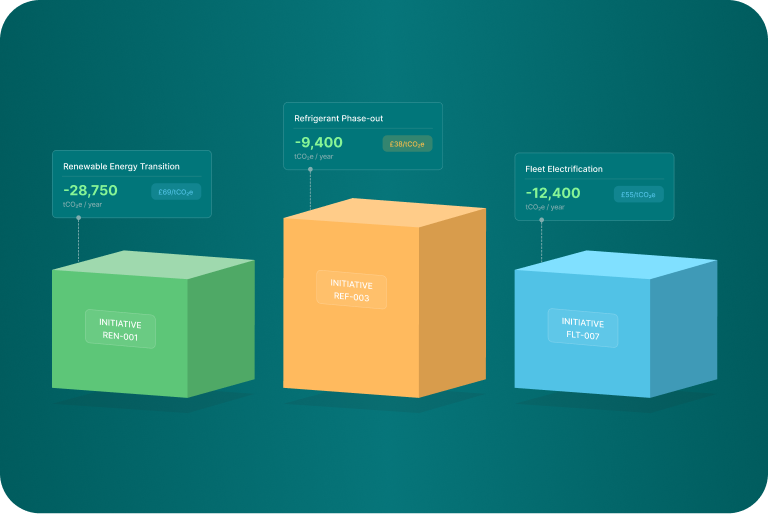
Turn emissions data into sustainability strategy

Flexible analytics on live sustainability data. Works like Excel, but does what Excel can't.

70%
Reporting cycles reduced using Analytics capabilities
1 Million+
Rows exported without performance issues
15+
Chart types to visualise data however you need to

Live data you can drill into, reshape, and deliver however it's needed

Present live to the board and drill into any question on the spot
Build custom analysis with Excel-like tools – no IT, exports, or lost audit trail
Serve finance, procurement, and leadership from one dataset
Get alerted when trends and anomalies surface

Create custom reports faster than Excel with full traceability

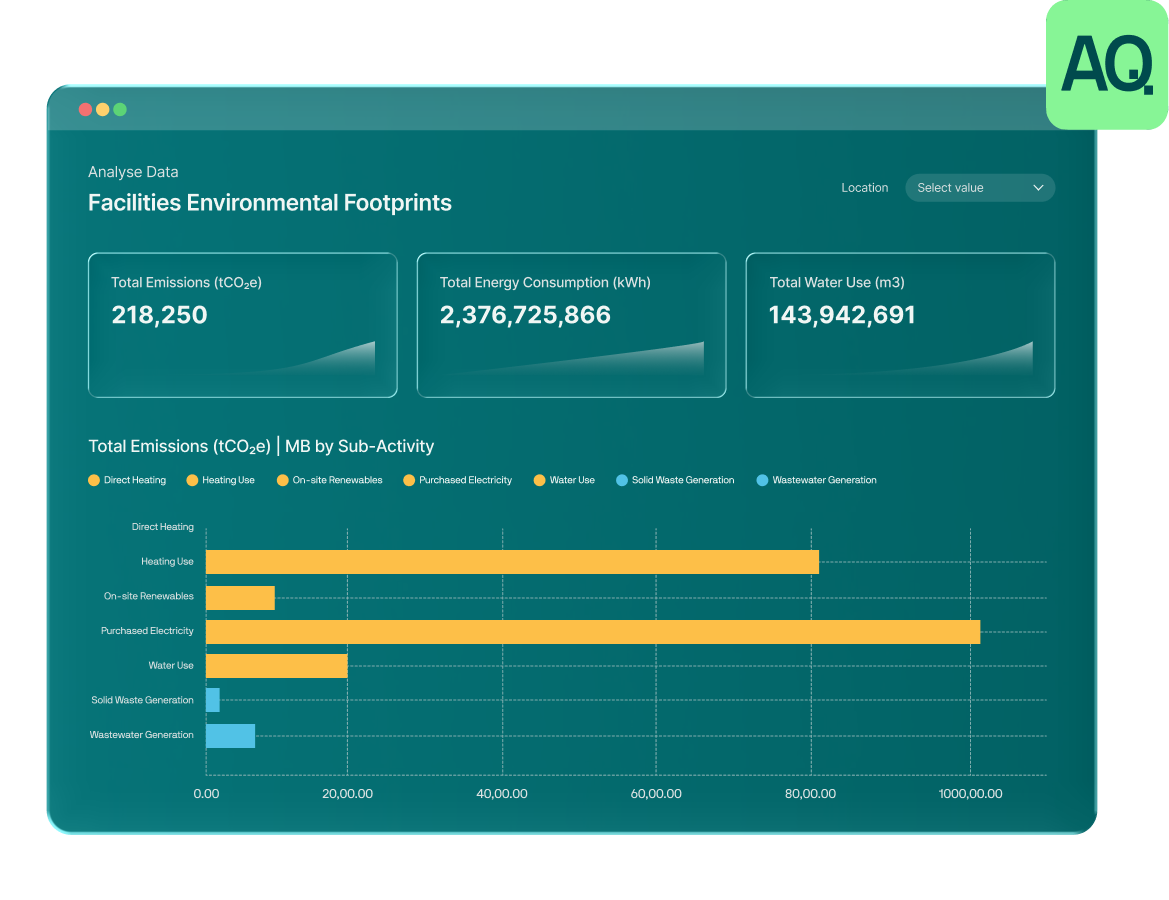
Build custom analysis on live sustainability data using tools you already know. No exports, no IT tickets, no broken audit trails.

Works like you already do
An Excel-like experience on live sustainability data. Write formulas in familiar syntax, build pivot tables and create charts.
Explore CSRD reporting
Build analysis exactly how you need it
Different teams need different cuts of the same data. Build every internal report yourself without IT tickets or separate tools. Automatically kept up to date as your data refreshes.
Explore CSRD reporting
Fast to build with zero maintenance
Build a complete dashboard in under an hour. No re-exporting, rebuilding – data updates automatically and the audit trail stays intact.
Explore CSRD reporting

See exactly what's behind every number

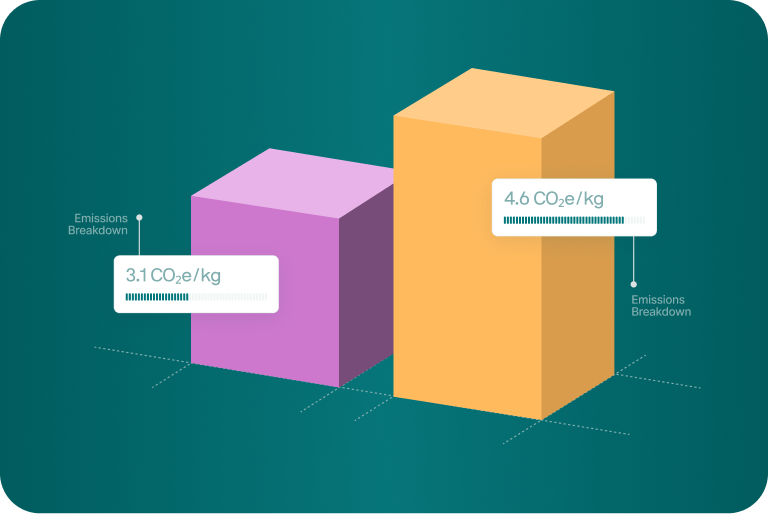
Click any number to see what's behind it – source data, emissions factors, methodology. Drill deeper by region, supplier, facility, or activity. Present live to the board and answer any question on the spot.

Drill into the detail
Click any value to drill deeper – from summary to region to supplier to individual activity. Or ask Evie to explain what you're seeing in plain language. Coming soon in Beta.
Understand the calculation
See which emissions factors and methodology were applied, and where the data came from. You can trace any number back to its source.
Answer follow-up questions on the spot
Present live data to the board – when someone asks a question, click through to the answer. When auditors want methodology, it's there.

Data monitoring and reporting that runs itself

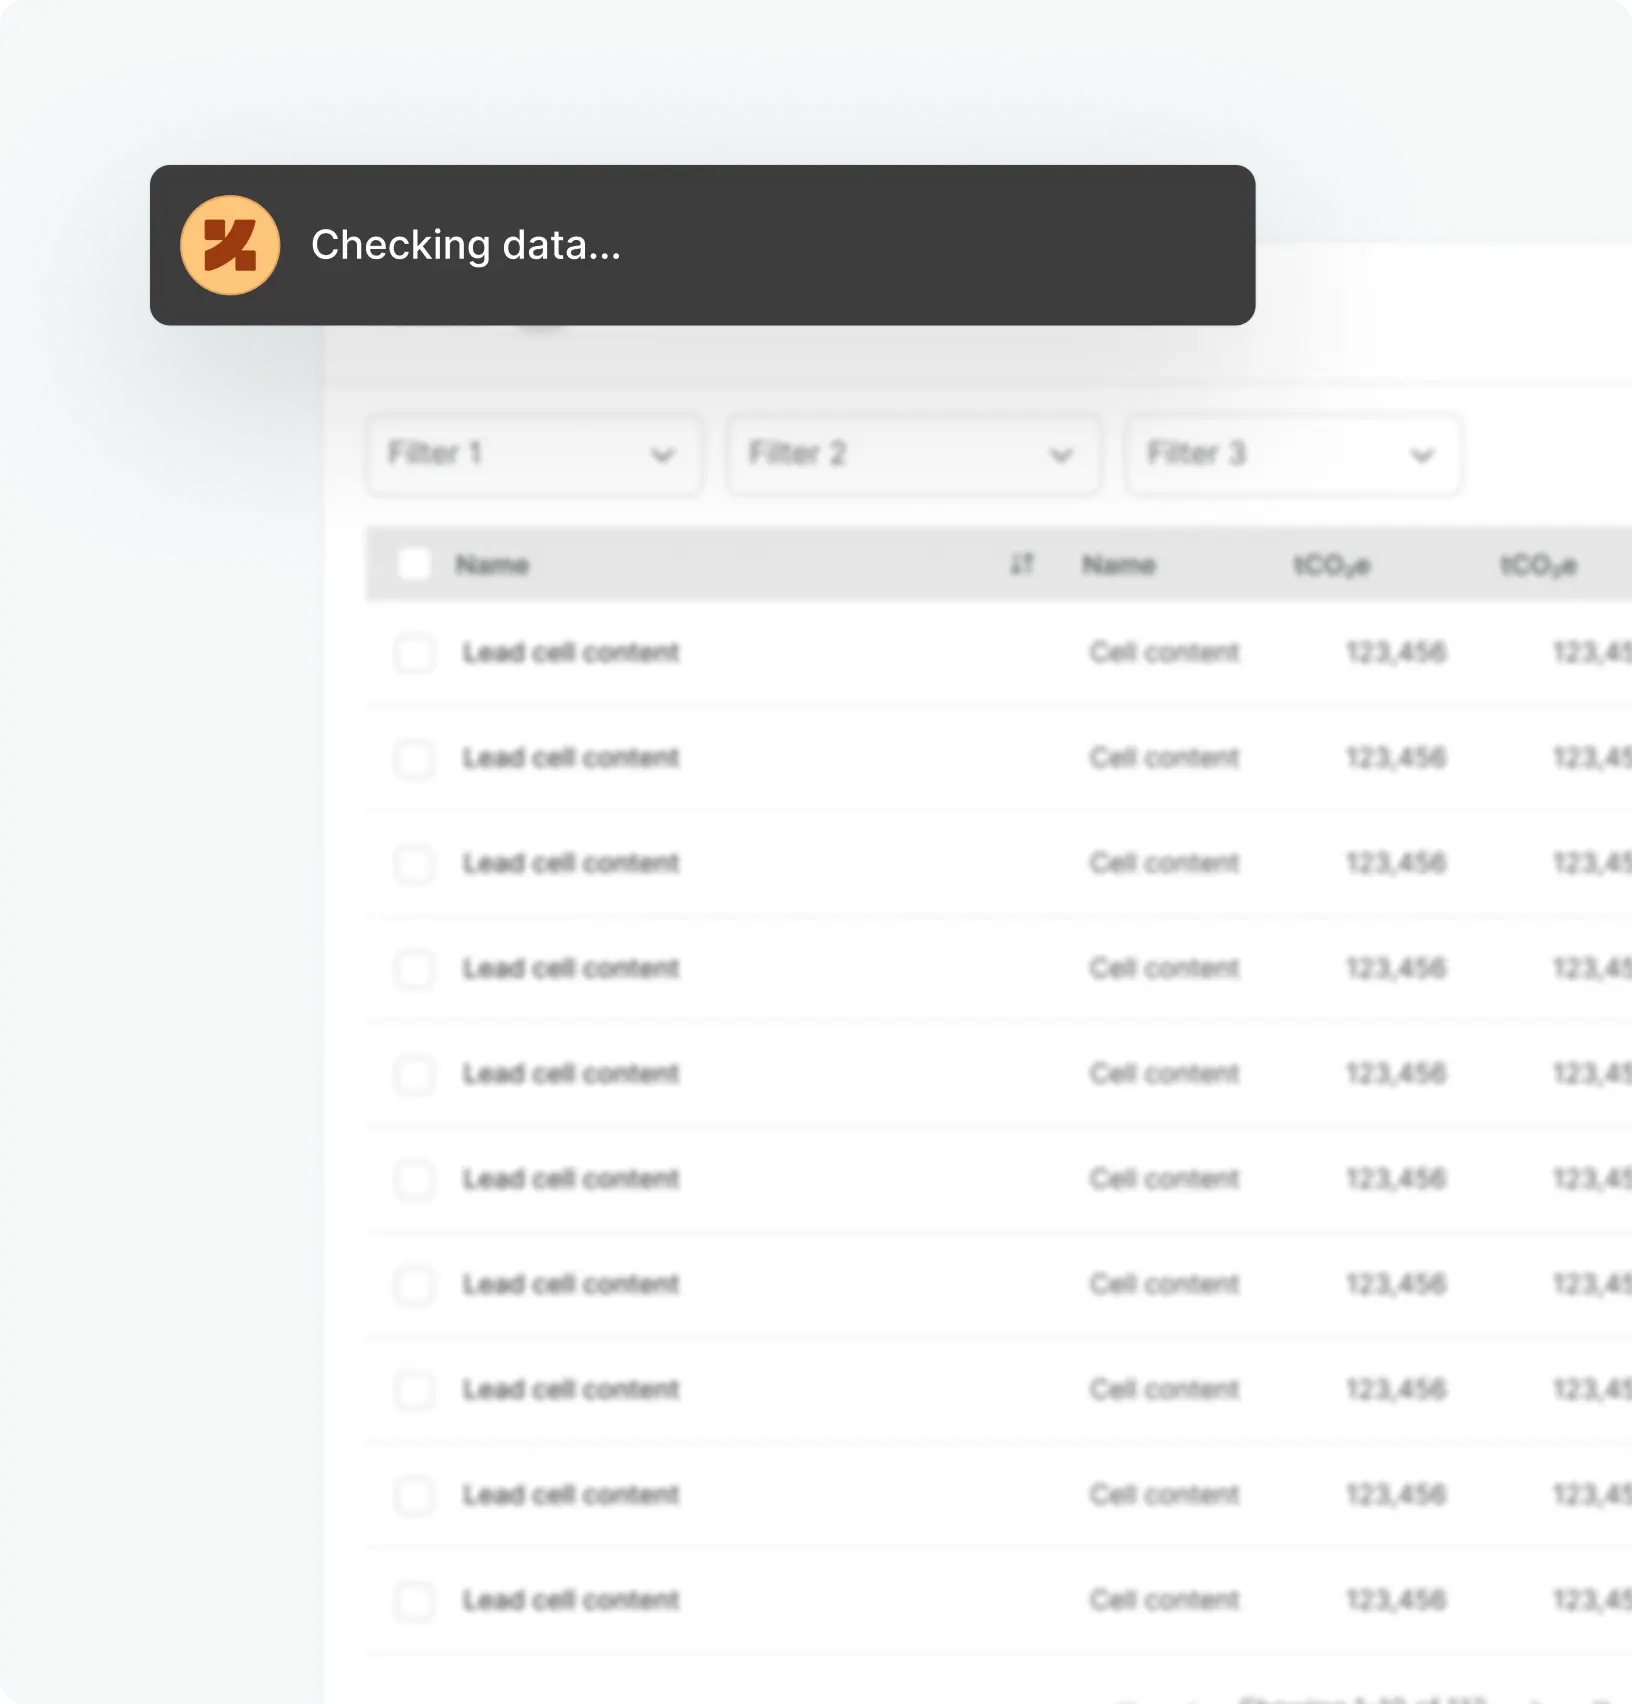
Stop manually checking reports for changes. Set thresholds for any metric and get notified when they're crossed. Schedule recurring reports to send automatically and surface issues before they become problems.

See more about Security
Get notified when emissions spike
Set threshold alerts for emissions, spend, or any metric. Get notified straight in your inbox when they're crossed.
Explore CSRD reporting
Catch anomalies early
Unusual patterns get flagged before they reach your reports. A quantity suddenly 10x higher? You'll know.
Explore CSRD reporting
Automate recurring reports
Schedule recurring exports (PDF, Excel, CSV) to run daily, weekly, or monthly and email stakeholders automatically.
Read more about Security

Take full control of how you analyse sustainability data

Book a 30-minute demo to see how you can build custom analysis
with Excel-like flexibility on live data

Built for messy enterprise data

Altruistiq Data has been designed for the reality of enterprise sustainability data – inconsistent naming, mixed formats, legacy systems, and incomplete fields.

We automatically handle data transformation and classification using AI. Your data stays in Altruistiq's ISO 27001-certified environment, always.

Not a rigid template system
Altruistiq doesn't force you into predefined formats. It adapts to your data structure, whether that's disconnected Excels, ERP exports, or well-organized data lakes.
Explore CSRD reporting
Full traceability
Every data transformation, classification decision, and mapping choice is tracked in the audit log. See exactly how raw data became clean, categorized emissions data.
Explore CSRD reporting
Stay in control
Evie does the heavy lifting but never makes changes without your approval. Review, adjust, or undo any action before it's final.
Explore CSRD reporting
case studies

See how our customers are shaping business decisions with climate data

“There’s been so much joy for me in being able to visually tell a story through the data. I think for me it’s about being able to communicate impact in a way that anyone can understand.”
63%
Statistic label
1.8x
Statistic label
900k+
Statistic label
Emma Detain
Sustainability Manager @ Huel
Woman with auburn hair wearing a blue striped shirt and white skirt sitting on a light gray couch in a warmly lit modern room.
“Having better quality data and being more accurate in our analysis allows us to support better decision making. Altruistiq has really enabled that.”
63%
Statistic label
1.8x
Statistic label
900k+
Statistic label
David Spitzley
Director of Impact Measurement @ Starbucks
Man in black shirt gesturing while speaking in front of a bookshelf with books and plants.
“We're seeing analysis like we've never seen before with the Altruistiq platform. I can actually see the bottle of ketchup and the impact broken down into components. It's completely new information that used to take months to collect.”
63%
Statistic label
1.8x
Statistic label
900k+
Statistic label
Steff Kulis
Head of ESG Digital Transformation @ Kraft Heinz
Side profile of a woman with long red hair and glasses wearing a navy blue floral top, standing indoors near shelves with a globe and scales.

How it works

Step 1
Connect your data
Your sustainability data is already in Altruistiq. Select corporate footprint, product footprint, or supply chain to start your analysis. Live data appears instantly.
Step 2
Build your analysis
Drag tables, pivot tables, and charts onto the canvas. Write formulas with autocomplete. Group, sort, and filter to answer specific questions. Build a complete dashboard in an hour or less.
Step 3
Add interactivity
Let viewers filter data themselves. Configure drill-down paths for exploration. Set up alerts when thresholds are crossed.
Step 4
Share and automate
Publish to share. Schedule recurring exports (PDF, Excel, CSV) to email stakeholders daily, weekly, or monthly.
That’s not all we do

What you can achieve with Altruistiq

Decarbonisation Planning

Model scenarios, track initiatives, visualise progress. Dashboards update as your footprint changes.
Explore decarbonisation planning

Target Setting & Voluntary Reporting

Build disclosure-ready dashboards that pull from your live footprint. Automate recurring reports for quarterly updates.
Explore Reporting

Eco-Design

Compare formulations, see what drives impact, and model lower-carbon alternatives. Visualise trade-offs between ingredients, packaging, and processing.
Explore Scope 3 accuracy

Take full control of how you analyse sustainability data

Book a 30-minute demo to see how you can build custom analysis
with Excel-like flexibility on live data

FAQs

How quickly can we get to an audit-ready baseline?

Weeks, not months, with our implementation team handling the heavy lifting.

You provide operational data. We handle methodology, emissions factors, validation, and audit trails. Most enterprises are compliance-ready within 90 days of kickoff – fast enough for Q1 CSRD deadlines without overwhelming your team.

How much does this cost, and can we start small?

Modular pricing means pay only for what you need. Start with one use case, scale as you grow.

Instead of spending £150K on a one-off consultant report that's outdated in 6 months, turn that into ongoing operational intelligence. Start with CSRD compliance or SBTi target-setting – whichever deadline hits first – then expand to strategic planning and stakeholder reporting when ready.

Can you handle our multi-entity complexity?

Yes – built for 5 to 500 entities across multiple countries and currencies.

Multi-entity consolidation, multi-country operations (150+ countries), multi-currency reporting, enterprise access controls. Different teams see their data, leadership sees consolidated view, auditors get full trail.

What if we already have a baseline from consultants?

We'll migrate your existing baseline and maintain historical comparability.

We import your consultant baseline as Year 0, map methodology alignment, flag any gaps, then continue with continuous platform tracking. You're building on existing work while moving from annual snapshots to continuous intelligence.

Is your methodology actually audit-ready, or will we need remediation?

ISO14064-1 assured methodology used by enterprises passing Big 4 audits – 100% assurance success rate.

Full traceability, version control, standards alignment. We've never had a client fail assurance or require major baseline remediation. If auditors raise methodology questions, our team provides technical support at no cost.

Do we need technical expertise to use this?

No – Altruistiq is designed for sustainability professionals, not IT experts. Evie makes complex analysis accessible.

Ask natural language questions, get visual insights in minutes without SQL expertise or data science skills. Our implementation team provides training. Advisory support available ongoing. You focus on strategy, we handle technical complexity.

How does this integrate with our existing systems (ERP, financial systems)?

API access for custom integrations. Our implementation team handles the technical setup.

Your data lives in SAP, Oracle, or custom systems. Our push-based data system integrates securely with your existing infrastructure – you push data to us (we never access your systems directly). SSO ready for enterprise access controls.

What about data security?

SOC-2 certified. ISO27001 compliant. Your data never leaves your secure instance with Evie AI.

  • Push-based data transfer (more secure – you control what we receive)
  • Your data security is non-negotiable
  • Row-by-row audit trail for full transparency
  • AWS-powered infrastructure
  • SSO ready for enterprise access control

With Evie, your data stays in your secure instance, it’s never sent externally for AI processing. You have complete control.