

.svg.webp)


What you'll learn


Choosing between cradle-to-gate and cradle-to-grave boundaries shapes how you calculate your PCF. This article will help you understand:
- The best calculation approach tailored to your needs
- The insights you can access with each methodology
- The best standard to follow for cradle-to-gate vs cradle-to-grave
Step 1. Understand PCF Boundaries
Cradle-to-gate
Cradle-to-gate tracks emissions from raw materials to factory gate. You capture:
- Raw material extraction and processing
- Every manufacturing step
- Transport between production stages
- Your direct operations
Once your product leaves your facility, the calculation stops. Distribution, consumer use, disposal fall outside your boundary.
For B2B companies this approach helps compare environmental performance across different processes and suppliers. Data collection is manageable because you're only tracking what happens in facilities you control (your own processes and operations), as well as supplier data you can request through existing relationships.
Cradle-to-grave
Cradle-to-grave tells the complete story. Start with everything in cradle-to-gate, then add:
- Distribution to customers
- How consumers actually use your product
- End-of-life recycling or disposal
This full lifecycle view reveals emissions you might never have considered.
Consumer brands and packaging companies can use this approach to uncover reduction opportunities across the entire value chain. From reformulating products to switching packaging materials that improve recycling rates. It allows you to take responsibility for your product's full journey, not just the part you directly control.
Step 2. Choose Your Calculation Approach
Your calculation approach depends on what you're trying to achieve. For example:
Use cradle-to-gate as a:
- Food processor working with farmers to reduce agricultural input emissions
- Packaging company collaborating with suppliers to switch to lower-carbon materials
- R&D team comparing prototype formulations during product development
Use cradle-to-grave as a:
- Packaged milk producer comparing chilled vs. shelf-stable products
- EU food company meeting Product Environmental Footprint (PEF) requirements
- Coffee company substantiating "carbon neutral" claims including consumer brewing at home
e we use PEF defaults to enable quick, compliant calculations, you can also override any parameters with your specific data whenever it become
PCF standards ensure everyone calculates emissions the same way. They bring consistency, accuracy, and comparability across different products and industries, helping organisations identify areas for emission reduction.
All relevant standards are built on the foundational principles outlined in ISO 14040 and ISO 14044, but with multiple options available, the choice can be overwhelming. Read on to hear why we recommend PACT as the best calculation methodology for cradle-to-gate, and PEF for full cradle-to-grave.
PACT for Cradle-to-gate Standardised PCFs
PACT addresses the challenge of exchanging consistent, supplier-specific PCF data across complex value chains. The framework enables businesses to move beyond generic emission factors to primary data from their actual suppliers.
PACT provides comprehensive guidance on calculating, verifying, and exchanging cradle-to-gate PCFs. Whether you're working with ten suppliers or ten thousand, every PCF follows the same methodology, uses the same boundaries, and delivers comparable results.
At Scale, PCF Exchange with PACT
As well as developing a calculation methodology, PACT also defines a data sharing standard. Learn more about how we’ve collaborated with PACT and Unilever to support PCF sharing via the PACT API at scale here.
PEF for Complete Cradle-to-grave PCFs
PEF stands as the EU's official methodology for product environmental labelling. For companies selling into European markets, it's not just recommended – it's becoming essential as regulations tighten.
Unlike ISO 14067 and GHG Protocol, PEF delivers granular, product-category-specific data that reflects actual consumer behaviour and distribution patterns. Where other standards offer frameworks, PEF provides the numbers you need to calculate real downstream impacts.
For example, PEF specifies that meat splits 60% chilled and 40% frozen during distribution, milk stays 100% chilled, and pasta remains ambient throughout.
For consumer behaviour, it captures that 85% of meat ends up in home fridges versus 15% in restaurant cold storage.
PEF for the Food & Beverage Industry
PEF stands out for Food & Beverage companies because it was built with industry input. It includes sector-specific guidance that other standards lack – detailed cooking energy assumptions, refrigeration patterns, and packaging end-of-life pathways tailored to food products.
While ISO 14067 and GHG Protocol provide foundations, PEF delivers the operational detail and regulatory credibility needed for accurate cradle-to-grave calculations.
How Altruistiq Automates Downstream Calculations
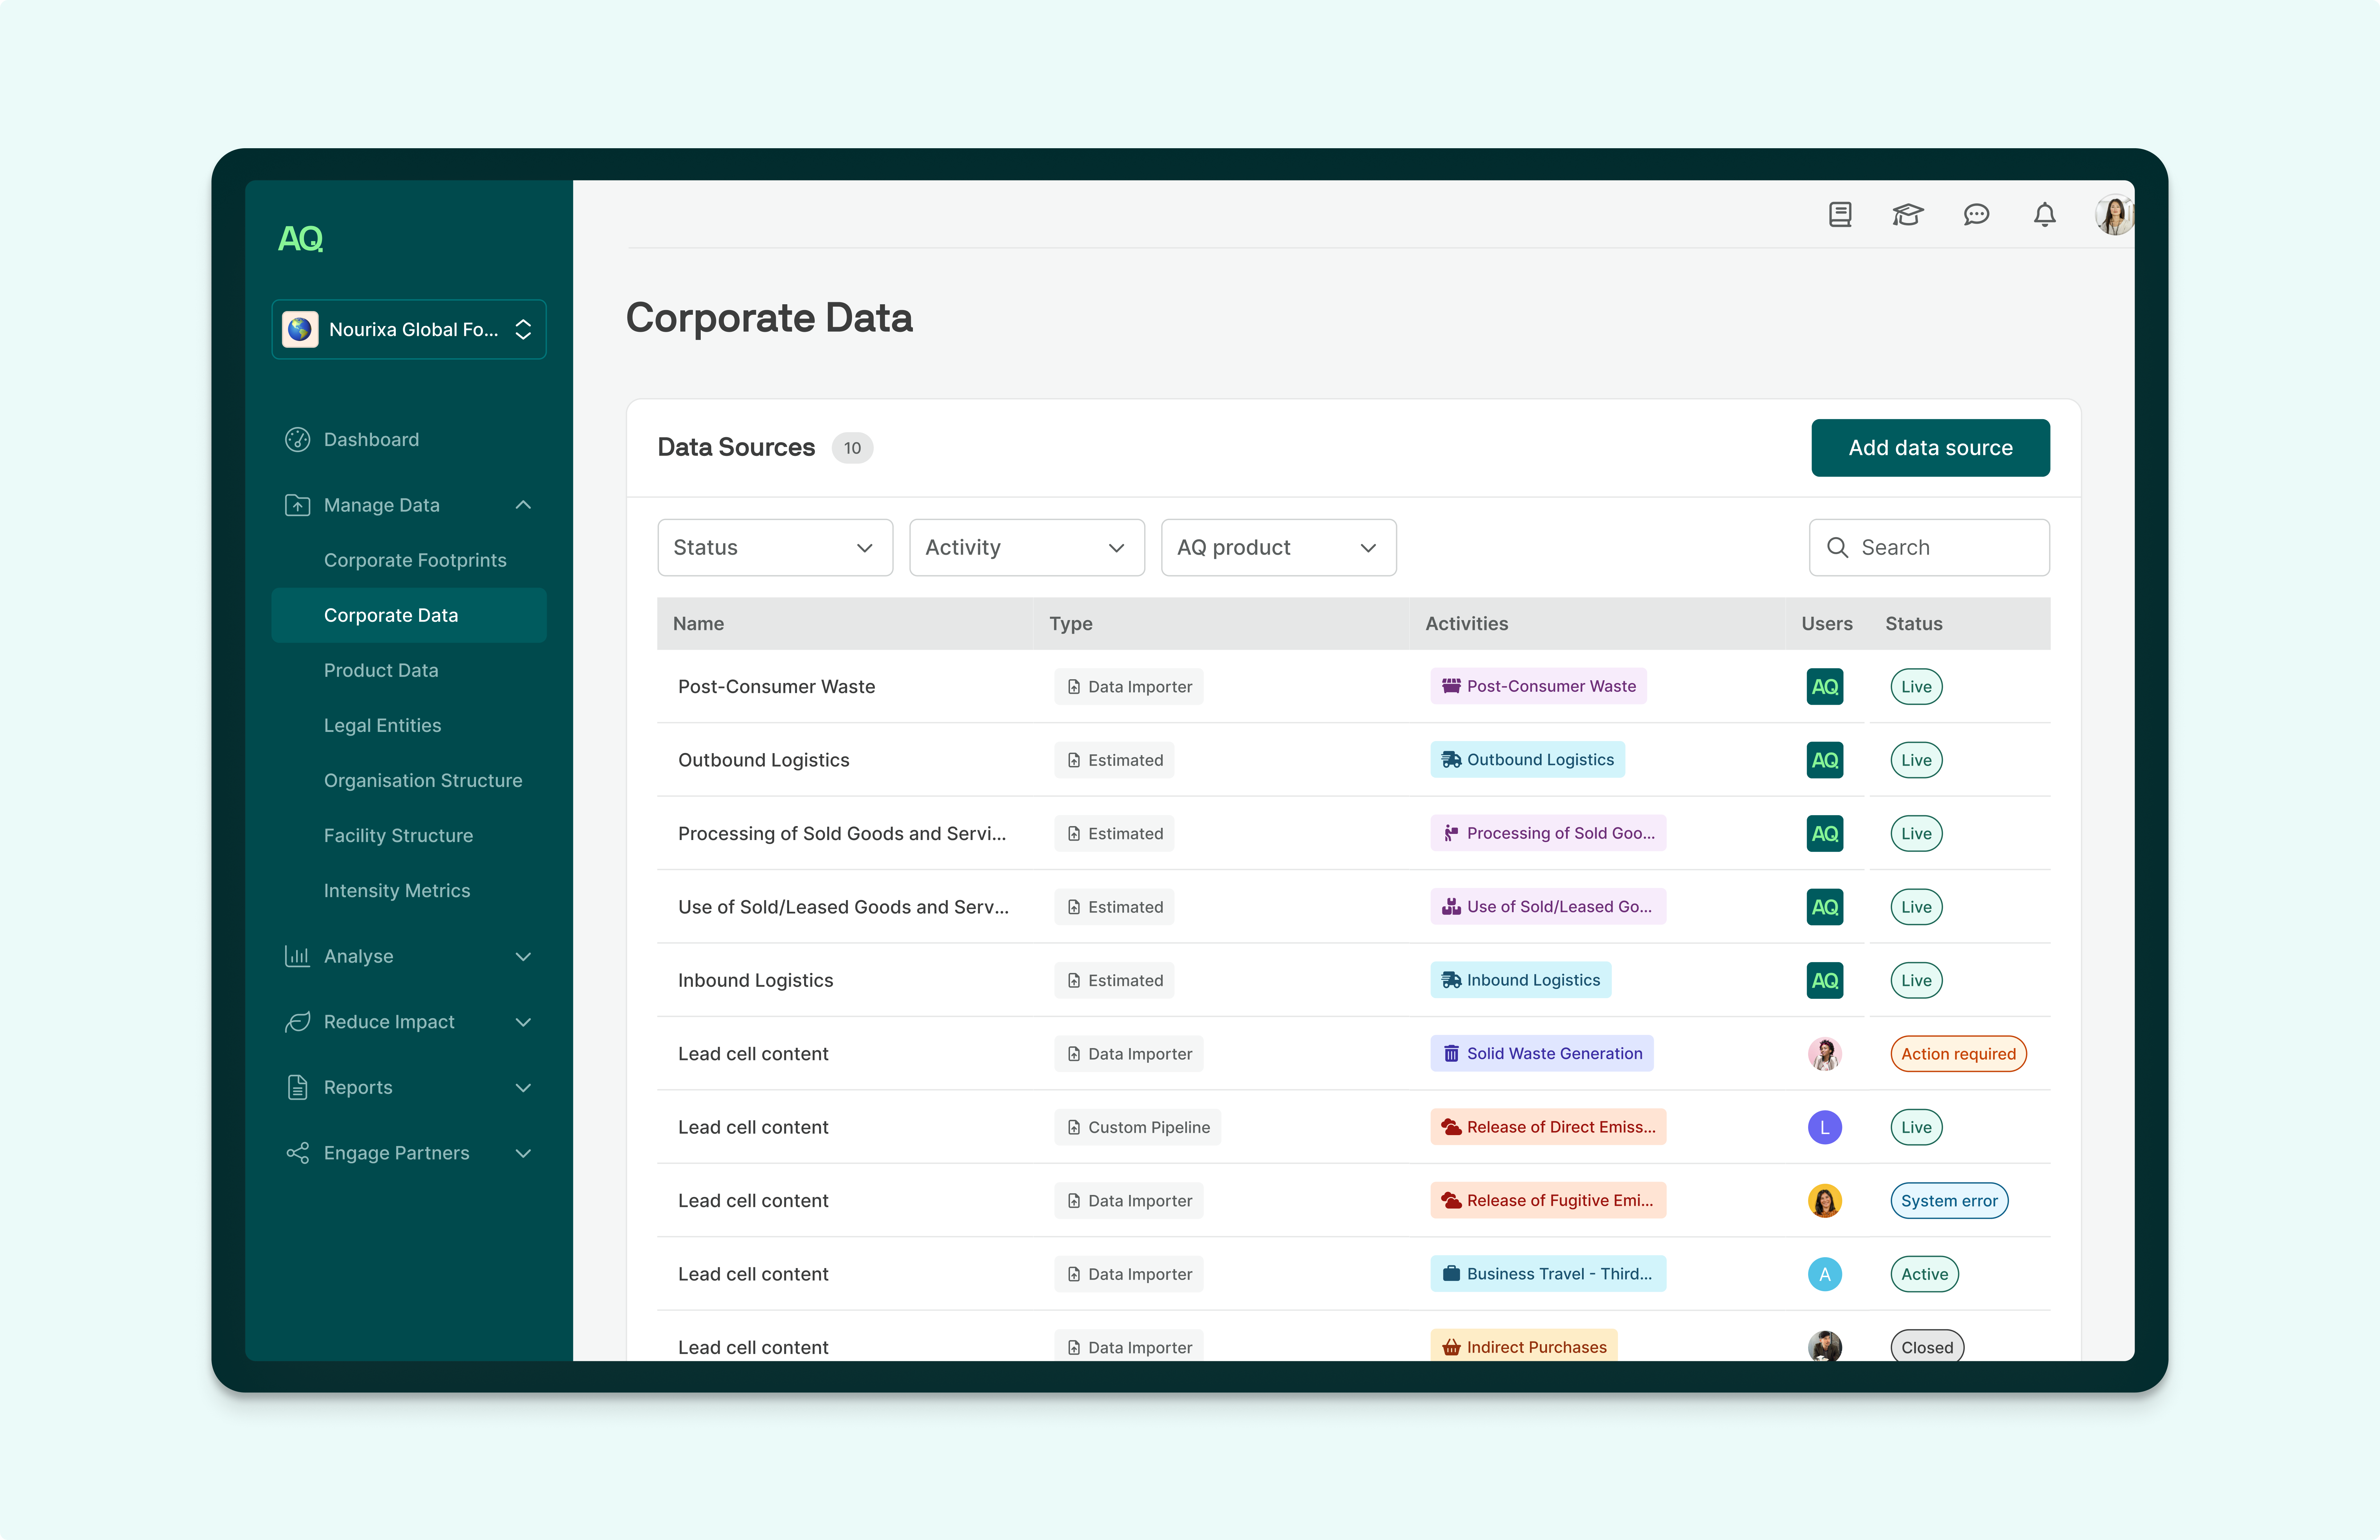
Missing downstream data shouldn't block your cradle-to-grave calculations. Our platform automates four key activities using PEF-compliant defaults:
- Outbound Logistics: Calculate transport from factory to consumer using actual weight, distance, and emission factors for each transport mode.
- Storage: Model energy consumption across distribution centres and retail, accounting for product-specific refrigeration needs.
- Product Use: Estimate consumer energy consumption including refrigeration time, cooking energy, and water usage based on product category.
- End of Life: Calculate recycling, incineration, and landfill impacts using regional waste treatment data, and apply PEF's Circular Footprint Formula to packaging inputs
Whilst we use PEF defaults to enable quick, compliant calculations, you can also override any parameters with your specific data whenever it's available.
Bonus: Mistakes to Avoid When Calculating PCFs
Mixing Boundaries
A dairy processor includes consumer refrigeration in their cradle-to-gate calculation. Result: inflated upstream emissions that makes them look worse than competitors using correct boundaries.
Wrong Storage Assumptions
A juice manufacturer applies ambient storage to their entire range. Their fresh juices actually require cold chain throughout distribution, causing them to underestimate lifecycle emissions by 30%.
Emission Factors Overload
A coffee roaster uses global coffee bean emission factors instead of farm-specific data, missing that their direct-trade beans from specific cooperatives had 40% lower emissions than industry averages.
Inconsistent Functional Units
A frozen food brand calculates PCFs "per package" for their family lasagna line, but packages varied from 400g to 1.2kg, making carbon intensity comparisons meaningless until they switched to "per 100g serving."
Oversimplified Consumer Behaviour
A beverage company assumes all consumers refrigerate their energy drinks for the same duration, missing that convenience store sales involve much shorter refrigeration periods than household purchases, significantly overestimating use phase emissions.

